Portfolio Dashboard
One screen for every client project — financials, delivery status & AI sentiment
A turnkey control panel for agencies and delivery teams managing dozens of concurrent engagements. Pulls live project data from Trello, enriches it with AI daily recaps, and gives executives instant portfolio visibility — with zero manual spreadsheet work.
Live instance: api.journeyh.io/project-recap · snapshot Apr 21 – May 21, 2026
Running 100+ projects means flying blind on money, risk & client health
| Challenge | Typical pain |
|---|---|
| Financial visibility | Spent vs in-flight value scattered across Trello lists, invoices, and spreadsheets |
| Portfolio roll-up | CEO/PM cannot answer “how much is in testing across all clients?” in under an hour |
| Client sentiment | Daily Slack/Trello noise — no structured score or trend line per account |
| Project health | Problems surface late; no color-coded history of good vs concerning days |
| Reporting overhead | Account managers manually compile status decks every week |
| Scaling delivery | Adding projects linearly increases coordination cost — not revenue |
What leadership actually needs
Production dashboard — 100 projects, real numbers, today
Journey Horizon runs this on a live client portfolio. Click the screenshot or the button below to open the same view in your browser.
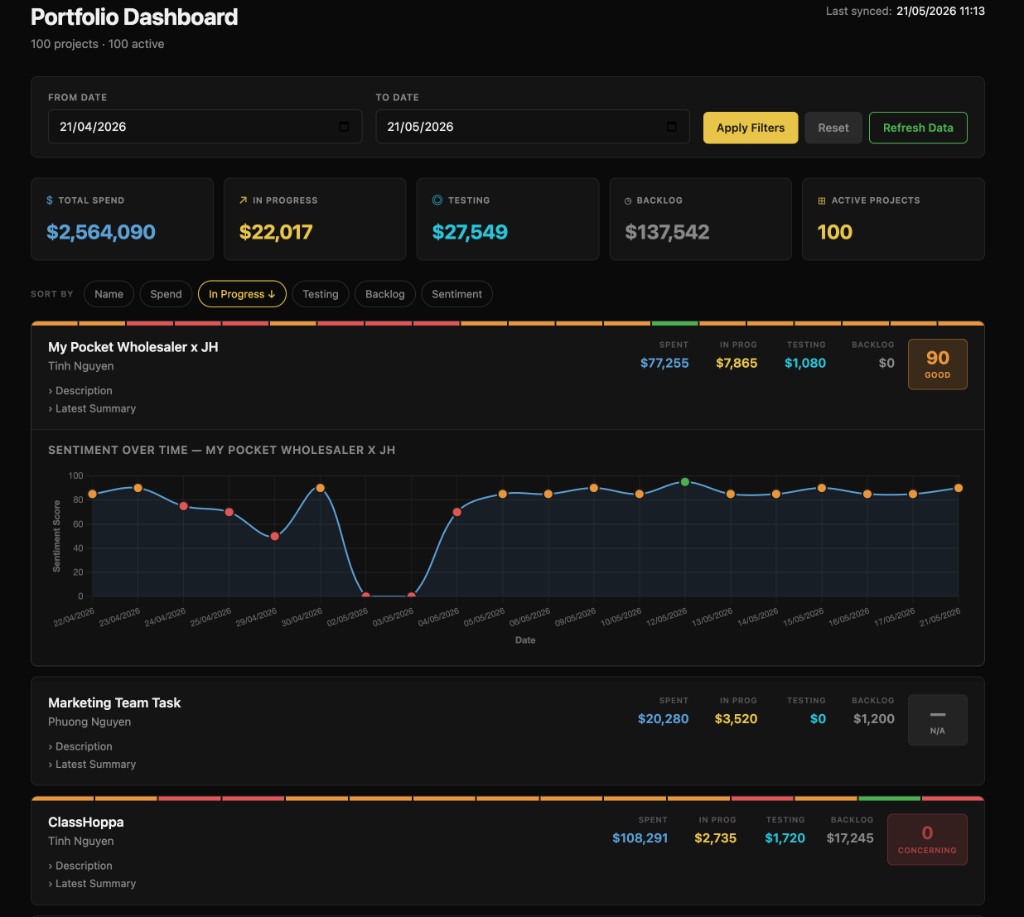
Five numbers tell the whole financial story of your delivery org
| Metric | What it means | Source |
|---|---|---|
| Total Spend | Completed / delivered work (Done or invoiced cards) | Trello card Potential Price |
| In Progress | Dollar value currently in active development | Trello “In Progress” list |
| Testing | Value in QA / UAT before release | Trello “Testing” list |
| Backlog | Approved but not yet started — future burn | Trello “Backlog” list |
| Active Projects | Client boards with priced cards (internal boards hidden) | NocoDB project config |
Why this matters for buyers
- Executives see portfolio-wide exposure — not one board at a time
- Sort by any column: name, spend, in progress, testing, backlog, or sentiment
- Date filters affect recap & sentiment history — financial totals stay accurate for the full board state
- Only priced cards count — no noise from tasks without commercial value
Every row is a client engagement — expand for sentiment history & daily recaps
| UI element | What the user sees |
|---|---|
| Project name + PM | e.g. “My Pocket Wholesaler x JH” — Tinh Nguyen |
| Four financial columns | Spent · In Prog · Testing · Backlog per board |
| Status bar | Color segments over the selected date range — green = healthy days, red = needs attention |
| Sentiment badge | Latest AI score: 90 GOOD, N/A, or 0 CONCERNING |
| Expanded chart | “Sentiment Over Time” line chart with scored data points |
| Description / Latest Summary | Collapsible project context + most recent AI recap markdown |
Sentiment scoring (0–100)
Each night, GPT reads 24 hours of Trello activity — comments, card moves, new work — and produces a markdown recap plus a numeric sentiment score. Higher = healthier client relationship signals in the activity stream.
Your team keeps using Trello — the dashboard updates itself
| Manual portfolio reporting | Portfolio Dashboard | |
|---|---|---|
| Data entry | Copy-paste from boards weekly | Zero — synced from Trello + config DB |
| Financial roll-up | Spreadsheet formulas, often stale | Auto-sum by card status & price |
| Client sentiment | Subjective PM notes | AI daily score from real activity |
| Historical view | Lost in email / Slack | Recap archive + chart over any date range |
| Time to portfolio view | Hours of assembly | Seconds — one URL, one screen |
| Scale to 100+ projects | Linear headcount increase | Same dashboard — sort & filter instantly |
Three sources you already have — one merged view
We connect to your instances — NocoDB (or equivalent config store), your Trello workspace, and your recap destination.
Three independent sync pipelines — merged at render time
boards.jsonProject config & PM mapping
trello-cards.jsonCards, prices, statuses
project_recap.jsonDaily recap & sentiment
| Cache file | Contents | Updated when |
|---|---|---|
boards.json | Project list, PM, active/internal flags | Server startup or admin sync |
trello-cards.json | All cards + price + list status | Scheduled Trello sync job |
project_recap.json | Full recap history + sentiment scores | After daily AI recap job |
Financial pipeline + AI sentiment pipeline in detail
💰 Financial pipeline (Trello)
- Fetch all cards from active client boards (internal boards excluded)
- Read each card’s Potential Price — cards without price are ignored
- Map Trello list → metric: Done = Spent, In Progress, Testing, Backlog
- Aggregate per board, then roll up to portfolio summary cards
- Expose card-level detail for modal drill-down on click
🤖 AI recap pipeline (daily)
- Cron job pulls 24h of Trello actions (comments, moves, new cards…)
- GPT summarizes activity + assigns sentiment 0–100
- Post recap to Discord for the delivery team (internal alert)
- Persist recap + score to Google Sheet
- Download full history to
project_recap.jsonon server
Recap runs only when a board had activity in the last 24h — silent boards show N/A until the next event.
/project-recap/refresh pulls latest recaps from Google Sheet on demand.Built for daily executive use — not a one-off report
| Action | Result |
|---|---|
| Apply date range (From / To) | Filter recap history & status-bar segments; re-sort list |
| Sort by Name, Spend, In Progress, Testing, Backlog, Sentiment | Instant re-order — e.g. find highest in-flight spend first |
| Click project row | Inline sentiment-over-time chart expands |
| Click status-bar segment | Modal with that day’s full AI recap markdown |
| Click Spent / In Prog / Testing / Backlog figure | Modal listing all cards in that bucket with prices |
| Reset filters | Return to default date window & sort |
| Refresh Data | Reload merged cache — sub-second portfolio refresh |
A sellable product — not a one-off internal tool
🤝 White-label ready
Deploy on your domain with your branding. Your clients see their portfolio — not Journey Horizon’s stack.
📦 Turnkey integrations
Connects to standard delivery tools: Trello for execution, a config DB for project metadata, Sheets + GPT for intelligence.
💼 Executive SKU
Package as “Portfolio Intelligence” for agency retainers — replaces weekly manual status decks with a live URL.
📈 Proven at scale
Live today on 100 active projects and $2.56M tracked spend — not a prototype.
🔧 Customizable rules
Map your Trello lists to metrics, hide internal boards, filter by priced cards only — fits how you already work.
🚀 Upsell path
Add Discord alerts, custom recap prompts per client tier, or client-facing read-only views — same architecture.
Common questions from prospects & partners
See your portfolio the way JH does
Open the live demo with real production data — then talk to us about white-label deployment for your agency or platform.
Journey Horizon · Portfolio Dashboard · api.journeyh.io/project-recap
Explore our AI product presentations
Three pitch decks — one platform story. Jump between marketing automation, SEO content, and portfolio intelligence.
Journey Horizon · journeyhorizon.com · Live demo: Portfolio Dashboard